From morning coffee and orange juice to fresh fruit, seafood, beef, and chocolate, many staples in American kitchens depend heavily on imports. That makes food prices particularly sensitive to changes in U.S. trade policy. Tariffs are taxes collected from U.S. companies when they import goods from abroad, increasing the cost of bringing affected products into the country. While businesses and foreign suppliers can absorb some of that added expense, research from the Federal Reserve has found that the tariffs imposed in 2025 pushed up retail prices, with those increases developing gradually as higher import costs worked their way through supply chains and onto store shelves. For American households, that means tariffs on food and beverages can show up where they are especially difficult to avoid: the grocery bill.
That risk has grown as tariffs have become a central feature of U.S. trade policy under President Donald Trump. Since returning to office in January 2025, Trump has used tariffs to pursue a range of economic and foreign-policy objectives, resulting in new or higher duties on goods from many of the countries that supply American consumers. The specific policies and rates have changed considerably amid negotiations and legal challenges, including a Supreme Court ruling in February 2026 that invalidated tariffs imposed under the International Emergency Economic Powers Act (IEEPA). Following the ruling, the administration temporarily replaced those duties with a 10% Section 122 surcharge, which expired in July 2026 by statutory limit and was succeeded by new Section 301 tariffs of 10% to 12.5%. But tariffs remain at an average effective rate of 6.7% as of July 2026, according to the Penn Wharton Budget Model, which is nearly triple the 2.3% average from before Trump returned to office, and that matters for the food supply. The U.S. imported over $219 billion in agricultural products in 2025, including large quantities of fruits and vegetables, coffee, cocoa, beef, alcoholic beverages, and processed foods. Many of these products are imported because they cannot be grown domestically at sufficient scale, are needed to maintain year-round supplies, or can be produced more economically abroad.
Not every item in the grocery cart is equally exposed. For some foods, imports represent only a small fraction of what Americans consume; for others, foreign suppliers provide a majority of the domestic supply. And because the U.S. sources different foods from different countries, changes in tariffs can affect products—and parts of the country—in very different ways. To better understand that exposure, Trace One—a global provider of AI-native Product Lifecycle Management (PLM) and regulatory compliance software for the food & beverage, cosmetics & personal care, and specialty chemical industries—analyzed the latest data from the U.S. Department of Agriculture (USDA), U.S. Census Bureau, and U.S. Bureau of Economic Analysis to identify the foods most dependent on imports, the countries that supply the largest shares of U.S. food and beverage imports, and the leading food and beverage import in every state.
Here are the key takeaways from the analysis:
- The U.S. agricultural trade deficit reached a record high in 2025. Agricultural imports exceeded exports by $43.7 billion in 2025, up from deficits of $31.9 billion in 2024 and $17.3 billion in 2023.
- More than half of the U.S. oat supply is expected to come from abroad. Imports accounted for 49.0% of domestic oat consumption in 2025 and are estimated to reach 53.4% in 2026, the highest share among all major agricultural commodities tracked by the USDA.
- Mexico and Canada dominate U.S. food and beverage imports. The two countries supplied a combined $81.2 billion in 2025, accounting for 37.8% of all U.S. food and beverage imports.
- Tariff exposure extends well beyond the largest trading partners. Countries with smaller overall shares of U.S. food imports are leading suppliers of major commodities, including Colombian coffee, Australian frozen beef, Indian frozen shrimp and prawns, and Ecuadorian cocoa beans.
- Coffee and beef are the most common top food import across the states. Unroasted coffee and fresh, frozen, or preserved beef rank as the leading food and beverage imports in seven states, each.
Is the U.S. Agricultural Trade Deficit Getting Worse?
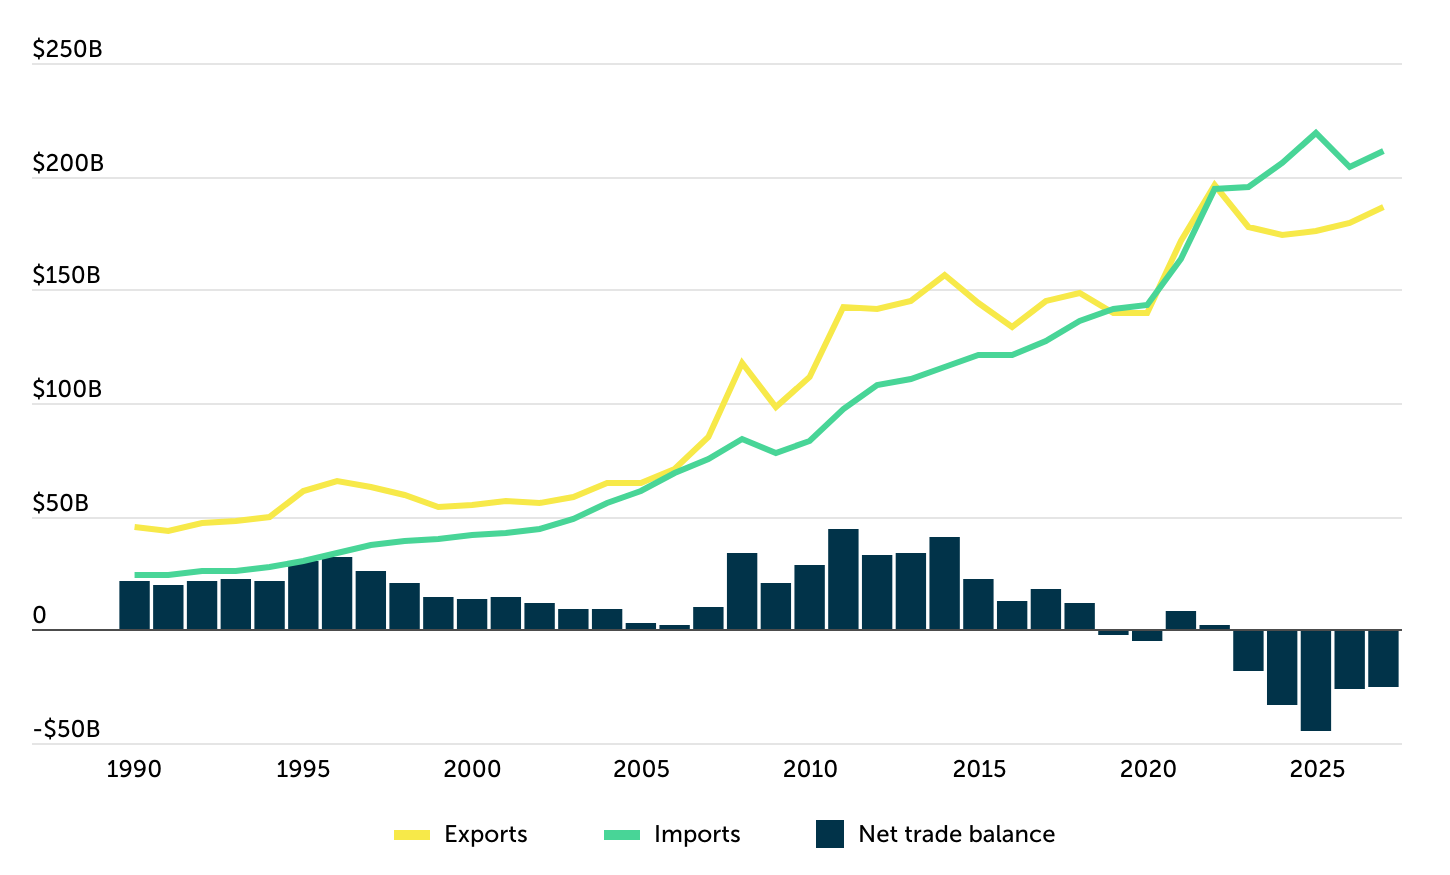
The U.S. agricultural trade deficit hit a record $43.7B in 2025
Source: Trace One analysis of USDA data
The growing importance of imported food is evident in the nation’s agricultural trade balance. For most of the past three decades, the U.S. exported more agricultural products than it imported. But that longstanding pattern has reversed—and the gap has widened rapidly in recent years.
In 2025, U.S. agricultural imports reached a record $219.4 billion, while exports totaled just $175.6 billion, resulting in a record $43.7 billion trade deficit when using the unrounded data. That was up from $31.9 billion in 2024 and $17.3 billion in 2023. The reversal is particularly notable given that the U.S. recorded agricultural trade surpluses exceeding $40 billion as recently as 2011 and 2014. The balance first moved into deficit in 2019, briefly returned to surplus in 2021 and 2022, and has remained negative since 2023 as imports have outpaced exports.
The deficit is projected to narrow over the next two years but remain historically large. The current forecasts put agricultural exports at $179.5 billion in 2026 and $186.5 billion in 2027, compared with imports of $204.5 billion and $211.0 billion, respectively. That would reduce the trade deficit to $25.0 billion in 2026 and $24.5 billion in 2027—a significant improvement from the 2025 record, but still a major departure from the trade surpluses that characterized much of the past three decades.
Which U.S. Foods Depend Most on Imports?
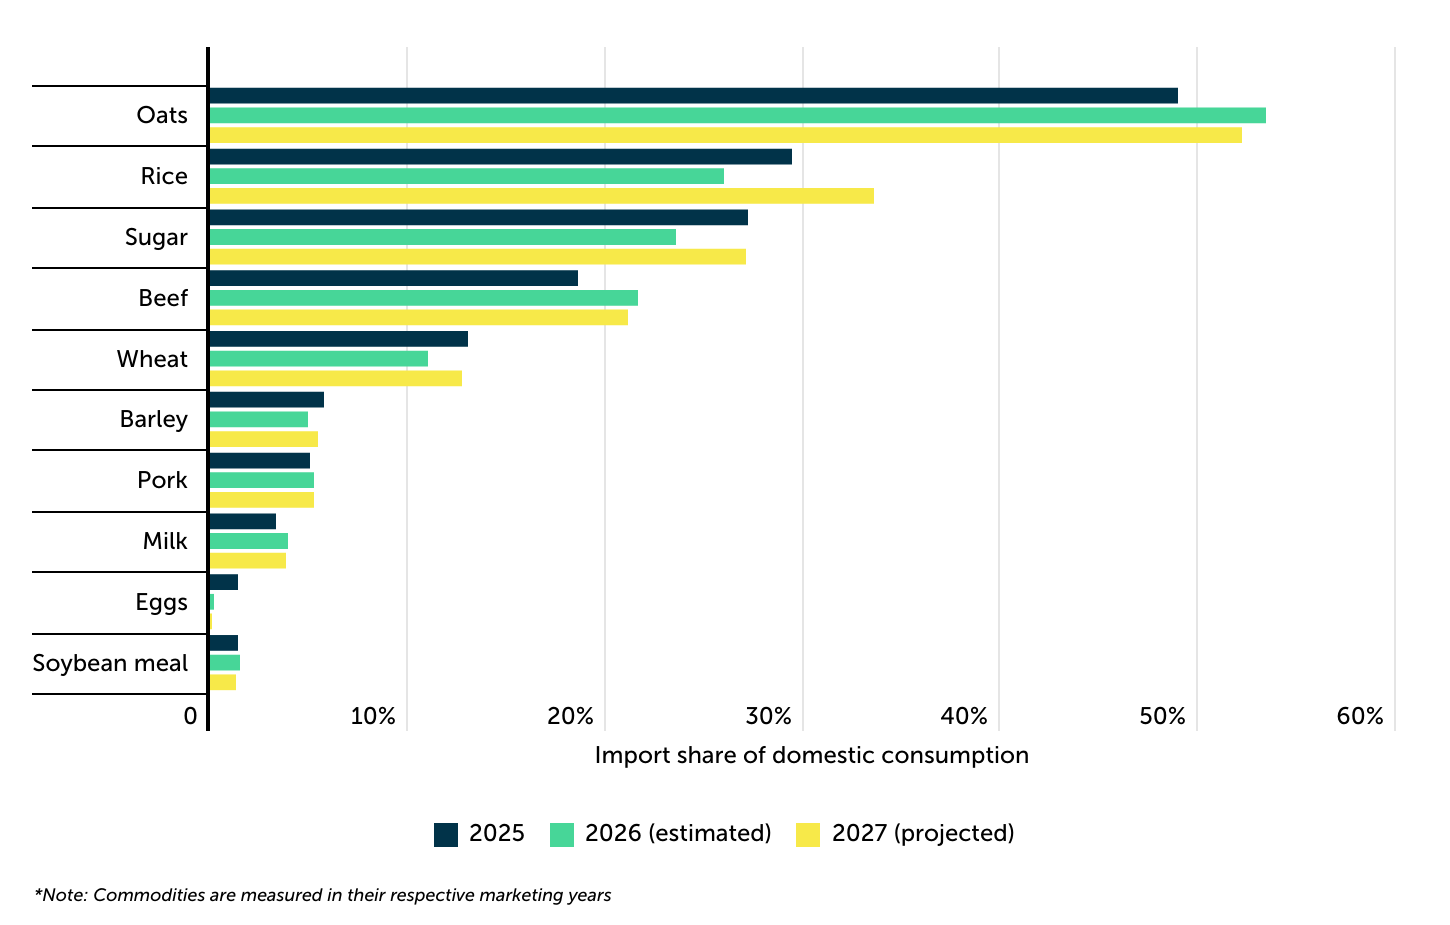
Half of all oats consumed in the U.S. are imported
Source: Trace One analysis of USDA data
The widening agricultural trade deficit shows how important foreign suppliers have become to the U.S. food system, but that dependence is much greater for some commodities than others. Among the major agricultural commodities analyzed, oats are the most dependent on imports: foreign supplies accounted for 49.0% of U.S. consumption in 2025, and that share is estimated to rise to 53.4% in 2026. This level of import dependence does not mean those supplies are necessarily subject to tariffs today, but it does make the commodities more vulnerable to changes in trade policy that raise the cost or restrict the availability of foreign goods.
The U.S. reliance on foreign oats largely reflects a long-term decline in domestic production. American farmers have shifted acreage away from oats toward crops such as corn and soybeans, while Canada has developed into the dominant supplier to the U.S. market. Rice and sugar follow oats, with imports accounting for 29.4% and 27.2% of domestic consumption, respectively, in 2025. Rice dependence is projected to increase to 33.6% by 2027, driven by a combination of lower U.S. production and continued demand for imported varieties—particularly aromatic rice, such as jasmine and basmati, that are predominantly supplied by Asian producers. Sugar imports, meanwhile, are a longstanding component of the U.S. market, supplementing domestic cane and beet sugar production under a federal program that regulates how much foreign sugar can enter the country at lower tariff rates.
Beef is another commodity where reliance on foreign supply is expected to grow. Imports accounted for 18.6% of U.S. beef consumption in 2025, rising to an estimated 21.7% in 2026 and a projected 21.1% in 2027. The increase comes as the U.S. cattle herd remains near historically low levels following years of drought, high production costs, and herd reductions, constraining domestic beef supplies even as consumer demand remains strong. The U.S. also imports lean beef used primarily in ground beef production, complementing the fattier beef produced domestically. Together, these patterns illustrate an important source of tariff vulnerability: when domestic production cannot readily replace foreign supply, tariffs or other trade disruptions affecting major suppliers have greater potential to work their way through the food supply chain and ultimately into consumer prices.
Which Countries Supply the Most Food and Beverage Imports to the U.S.?
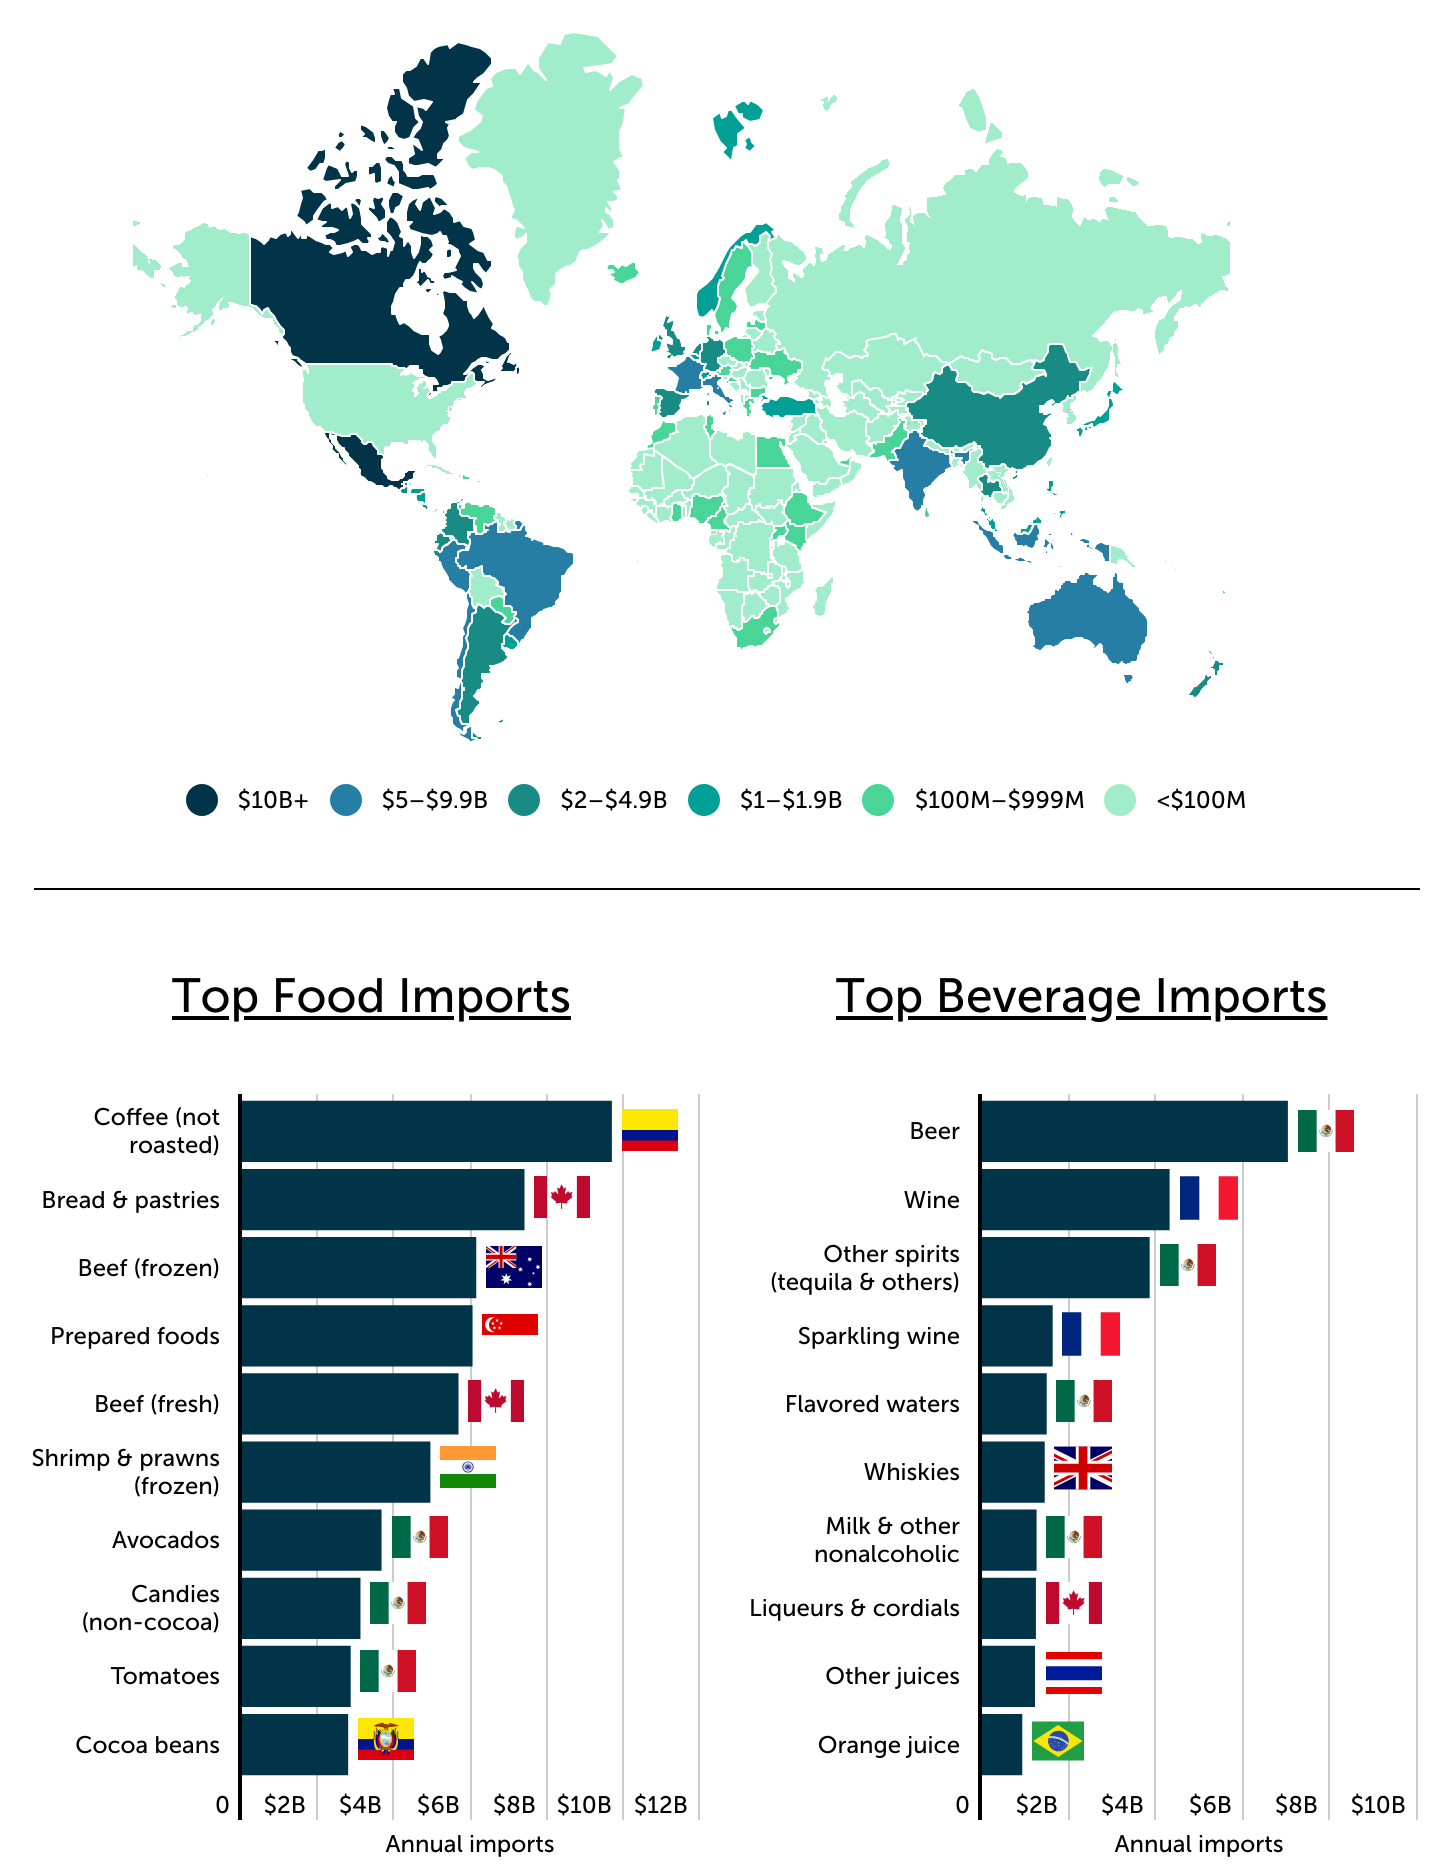
Food & beverage imports from Mexico & Canada account for 38% of the U.S. total
Source: Trace One analysis of USDA data
The potential impact of tariffs depends not only on how much food the U.S. imports, but also on where those imports originate. In 2025, the U.S. imported $214.9 billion in food and beverages—accounting for 98% of all agricultural imports in the U.S.—with more than one-third coming from its two closest neighbors. Mexico supplied $43.5 billion and Canada $37.8 billion (after rounding), together accounting for 37.8% of the U.S. total. No other individual country came close: Italy ranked third at $8.1 billion, followed by Brazil at $7.8 billion and Australia at $6.6 billion.
The concentration of trade with Mexico and Canada is especially important because both countries lead major food and beverage categories consumed across the U.S. Mexico is the leading source of four separate beverage commodity categories, including beer—the largest beverage import category. Mexico also supplies the most foreign avocados, non-cocoa candies, and tomatoes in terms of customs value. Meanwhile, Canada leads U.S. imports of bread and pastries, fresh beef, and liqueurs and cordials. These relationships reflect deeply integrated North American supply chains developed under NAFTA and continued under the United States-Mexico-Canada Agreement (USMCA). They also mean that changes in tariff policy toward either country have the potential to affect a broad range of products found in grocery stores, restaurants, and bars.
Other countries are similarly important within specific categories. Colombia is the leading source of unroasted coffee, Australia leads frozen beef, India leads frozen shrimp and prawns, and Ecuador leads cocoa beans. France is the top supplier of both wine and sparkling wine, while the United Kingdom leads whisky imports. This concentration illustrates another source of tariff vulnerability: even countries that represent a relatively small share of total U.S. food and beverage imports can be critical suppliers of individual products. As a result, tariffs targeted at particular countries or commodities can have a much larger effect on specific foods and beverages than their share of overall imports might suggest.
For U.S. food and beverage manufacturers, tariff exposure requires making strategic decisions about the products themselves, not just accounting for higher expenses. When an imported ingredient becomes more expensive or harder to source, companies can either absorb the additional costs, raise prices, switch suppliers, or reformulate their products. Switching suppliers means qualifying a new source and checking every specification, while reformulating recipes means updating specifications, checking compliance, and changing labels. For ingredients like oats, where imports covered 49.0% of U.S. consumption in 2025, the effects of those decisions can reach grocery store shelves very quickly.
“Switching suppliers to avoid a tariff is never just a purchasing decision. Every new source has to be qualified, every specification checked, and every label still has to be right. Tariffs turn sourcing into a product development problem.”
Saïda Aït, VP Global Marketing, Trace One
What Is the Top Food and Beverage Import in Every State?
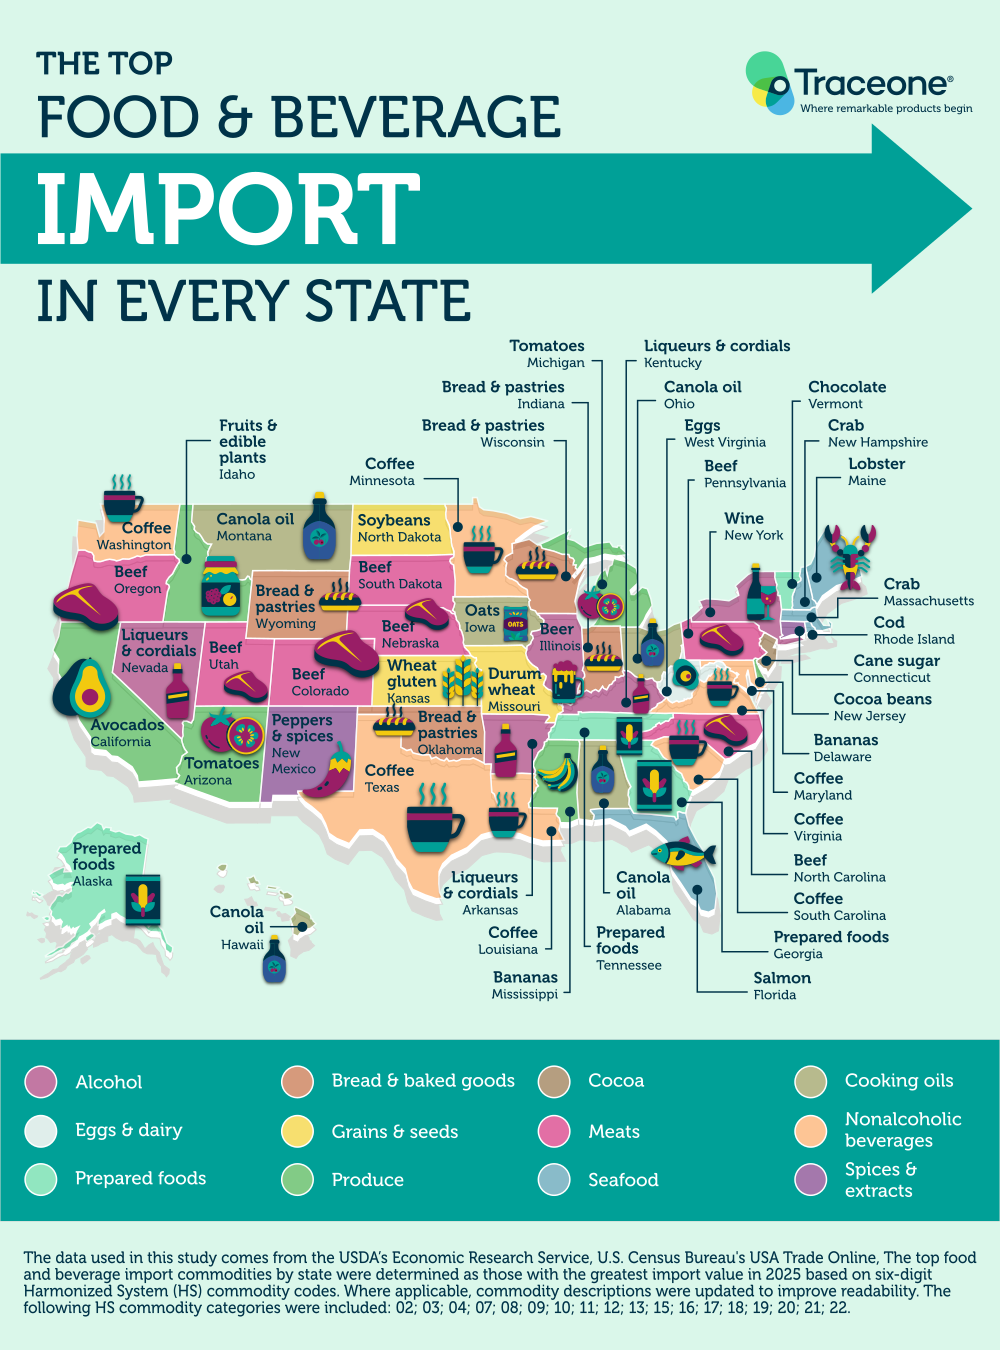
The top food and beverage imports by state vary greatly, spanning everything from cooking oils and prepared foods to meats, seafood, fresh produce, and alcohol. Coffee and beef rank as the leading imports in seven states each, while the bread and pastries category and canola oil each lead in four states. Prepared foods and the liqueurs and cordials grouping each rank first in three states. Interestingly, despite beer being the top imported beverage nationally, Illinois remains the only state where it ranks as the number one state-level import.
For complete results, see Which Foods Are Most Vulnerable to Import Tariffs? on Trace One. For a broader view of the domestic market, see Trace One’s Food & Beverage Manufacturing Industry Statistics page.
Methodology
Photo Credit: Studio Concept / Shutterstock
The data used in this study comes from the USDA’s Economic Research Service, U.S. Census Bureau’s USA Trade Online, U.S. Census Bureau’s American Community Survey, and U.S. Bureau of Economic Analysis’s Consumer Spending by State.
The top food and beverage import commodities for the U.S. overall, by country, and by state were determined as those with the greatest import value in 2025 based on six-digit Harmonized System (HS) commodity codes. Where applicable, commodity descriptions were updated to improve readability. The following HS commodity categories were included: 02; 03; 04; 07; 08; 09; 10; 11; 12; 13; 15; 16; 17; 18; 19; 20; 21; 22.
The share of households receiving food stamps (SNAP) was sourced from the 2024 American Community Survey, food insecurity data from the USDA covers the period from 2022 to 2024, and consumer spending data from the Bureau of Economic Analysis is from 2025.
For complete results, see Which Foods Are Most Vulnerable to Import Tariffs? on Trace One.

