
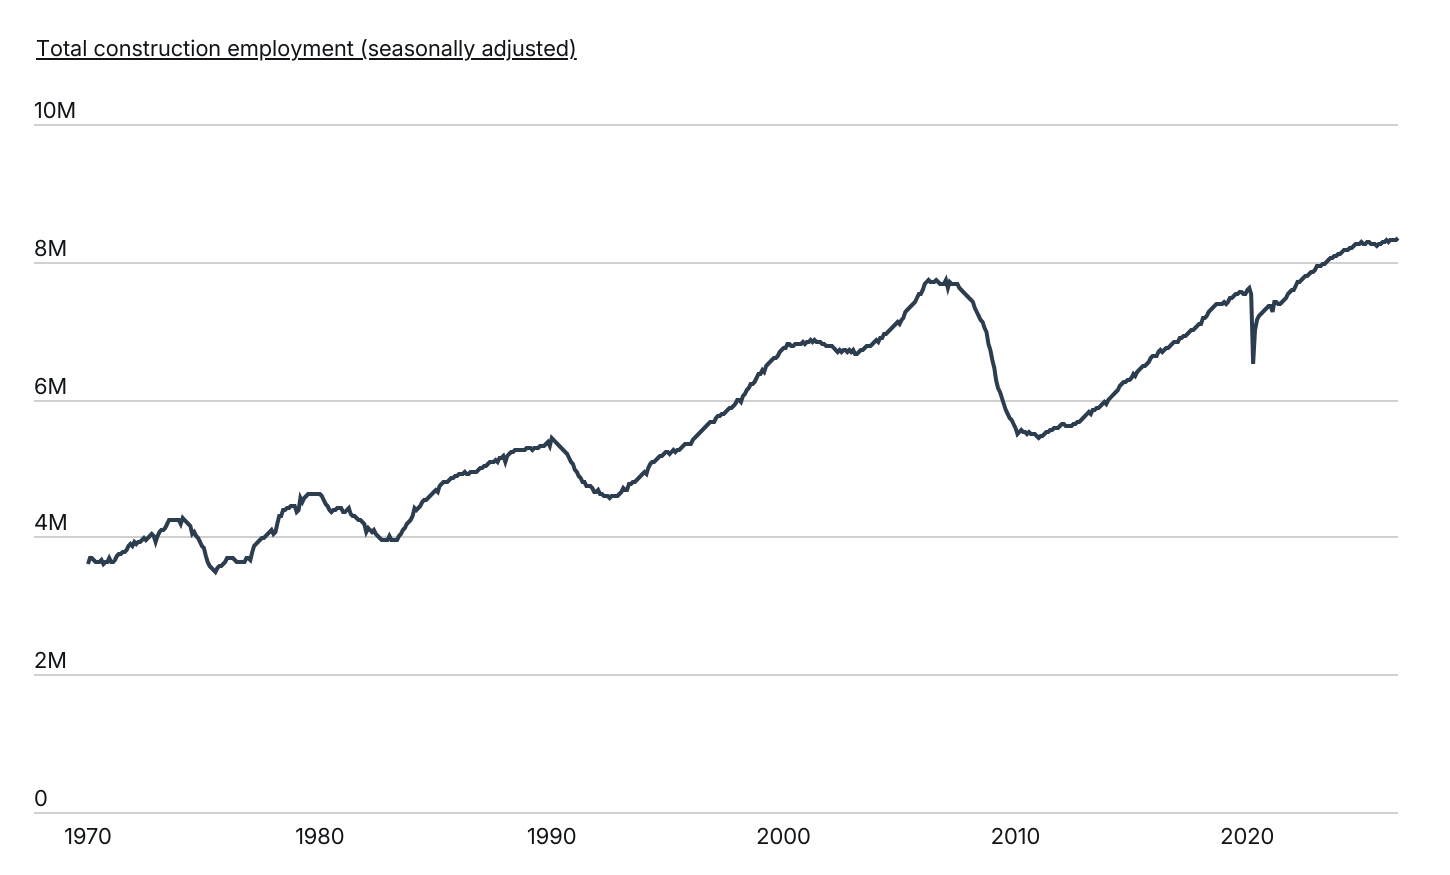
After navigating a stagnant period in 2025 marked by high interest rates and cost pressures, the U.S. construction industry has pivoted back toward expansion in 2026. Driven by large-scale infrastructure investments and manufacturing developments, total construction employment surged past 8.34 million by mid-2026—reaching an all-time record high. While hiring momentum has returned, persistent cost-of-living pressures mean that the true value of a construction worker’s paycheck continues to vary dramatically depending on where they punch the clock.
To uncover where trade professionals can stretch their earnings furthest in today’s economic climate, analysts at Construction Coverage—a publication covering construction trends, infrastructure, and industry research—evaluated wage data from the U.S. Bureau of Labor Statistics and cost-of-living metrics from the Bureau of Economic Analysis. By adjusting nominal pay for regional price differences across all 50 states and more than 350 metropolitan areas, this report highlights the cities and states where construction workers enjoy the greatest purchasing power—and where high living costs or lower base wages cut deepest into their take-home pay.
Here are the key takeaways from the analysis:
- Construction employment has resumed growth in 2026 after plateauing throughout 2025, reaching a new record high of over 8.34 million workers by mid-year.
- Construction workers earn a median annual wage of $59,540—nearly 17% higher than the $50,980 median across all U.S. occupations.
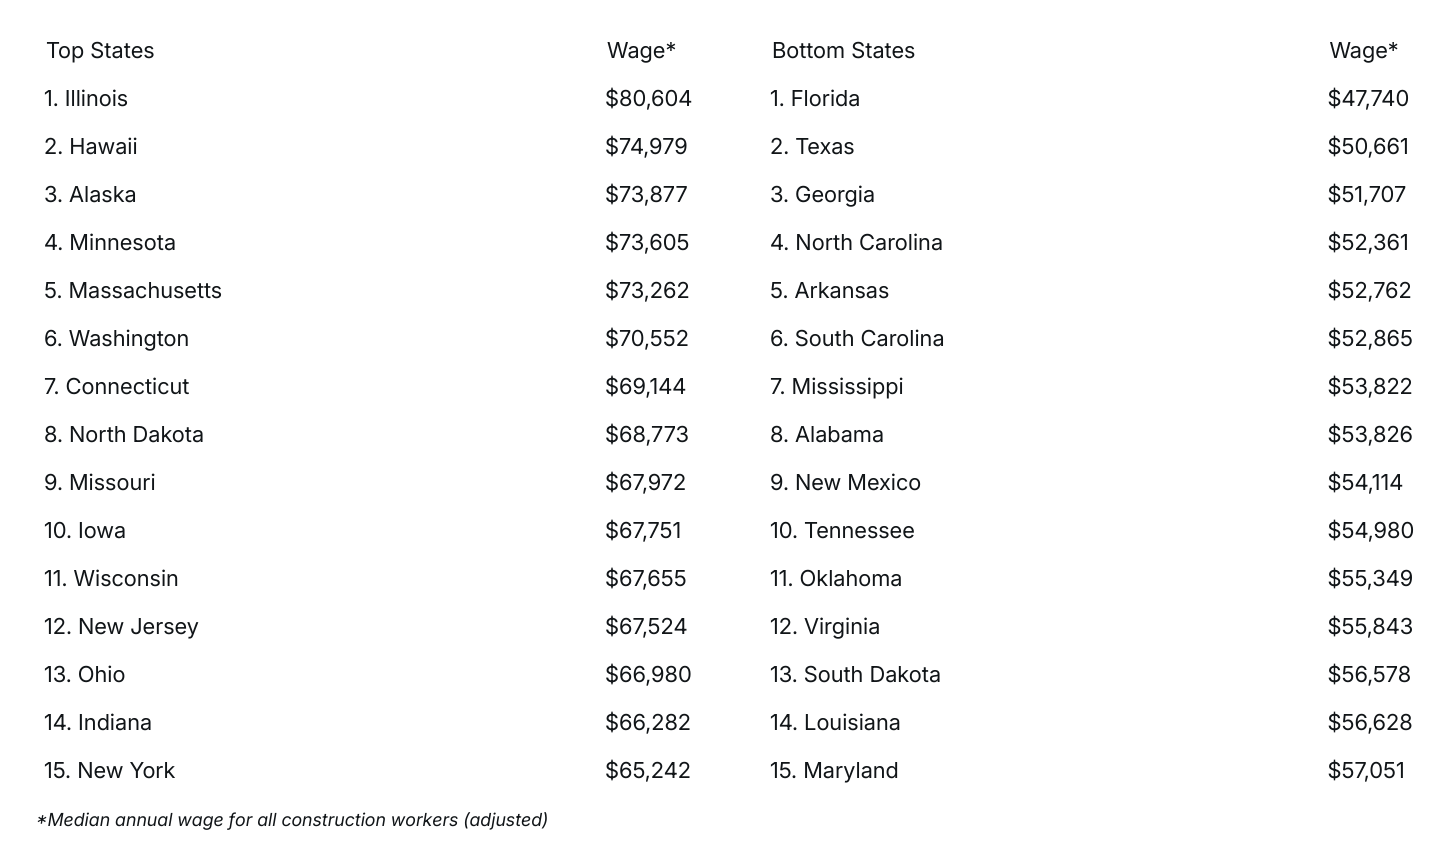
- Midwestern states offer some of the best cost-adjusted earnings. Led by Illinois at over $80,600 annually, eight out of the top 15 states are located in the Midwest.
- Southern states consistently pay construction workers the least, with nine out of the 10 bottom states being found in the South.
- Metro trends mirror state patterns, though several high-cost coastal areas—including San Jose, Boston, Seattle, and San Francisco—continue to deliver strong real purchasing power due to high nominal pay.
Cyclical Changes in Construction Employment
Construction employment surges to an all-time high
Source: Construction Coverage analysis of BLS data
The construction sector has long been a bellwether for the broader U.S. economy, typically contracting ahead of recessions and recovering more slowly than other industries. This was clearly visible during the COVID-19 pandemic, when construction employment dropped sharply to 6.5 million in April 2020. Yet the rebound was swift, driven by robust demand for residential housing, new manufacturing sites, and infrastructure projects. By mid-2023, total construction employment had climbed above 8 million for the first time.
After leveling off around 8.25 million throughout 2025 amid broader economic headwinds, growth has shown modest renewed momentum in 2026. Total construction employment surpassed 8.30 million early in the year and reached a new record high of over 8.34 million by mid-2026. While hiring velocity remains measured compared to the post-pandemic surge, one lasting effect of persistent labor market tightness has been strong wage growth. The construction industry generally compensates its workers well, especially considering that few construction occupations require a postsecondary degree. On a national level, full- and part-time wage and salary construction workers earn a median of $59,540 per year—nearly 17% more than the overall median wage of $50,980 across all U.S. occupations.
Regional Differences in Real Wages for Construction Workers
Illinois is the best-paying state for construction workers
Source: Construction Coverage analysis of BLS & BEA data
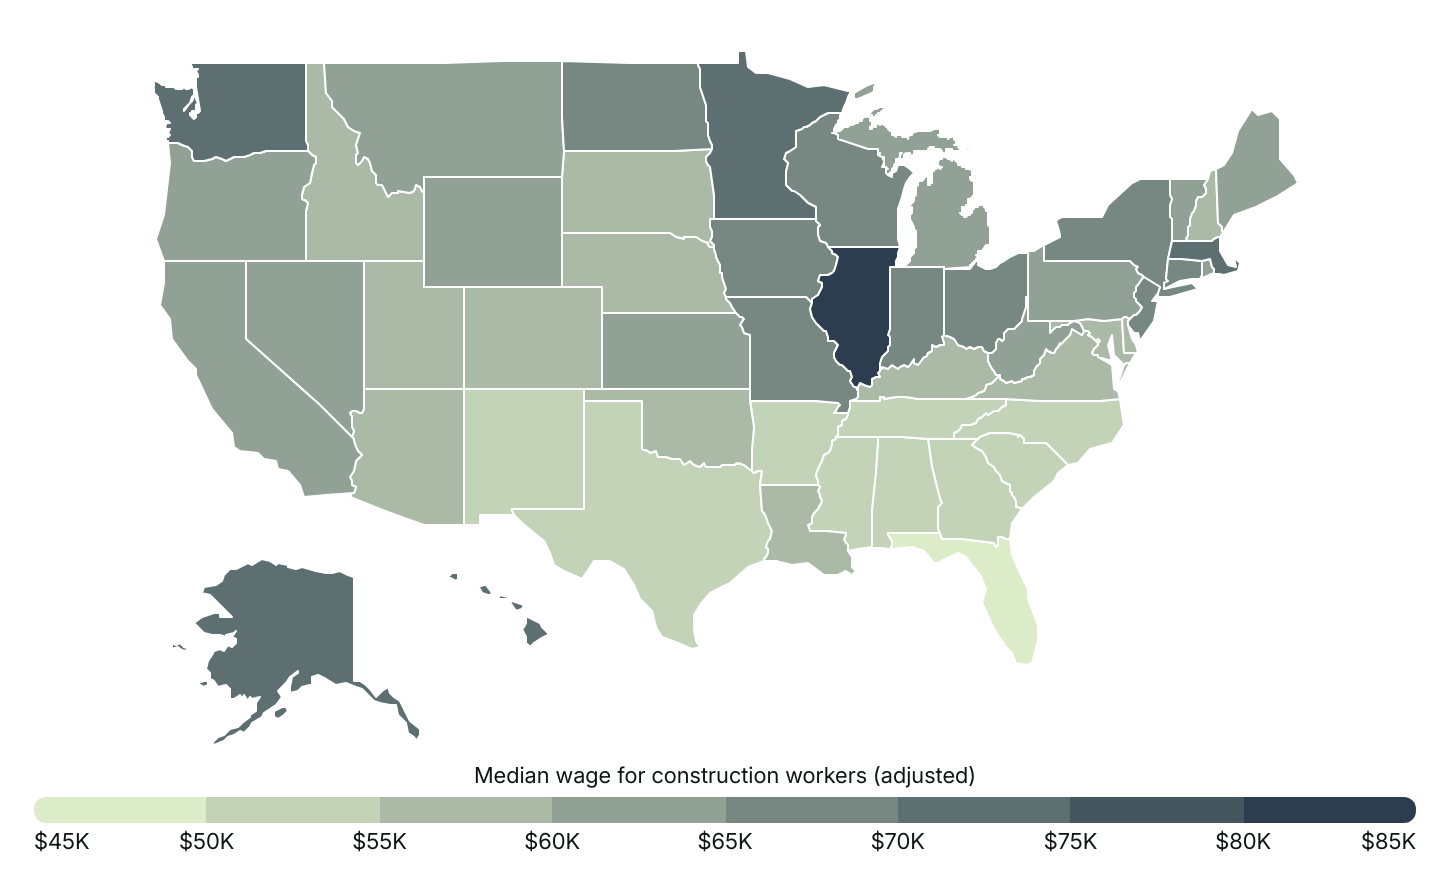
At the state level, the Midwest is home to many of the highest wages for construction workers after adjusting for cost-of-living differences. Illinois leads the nation with a cost-adjusted median annual wage of $80,604. Other Midwestern states also rank heavily among the top 10, including Minnesota ($73,605), North Dakota ($68,773), Missouri ($67,972), and Iowa ($67,751). These figures reflect both relatively strong nominal wages and more affordable living costs, allowing construction workers in these states to retain more of their earnings.
In contrast, Southern states consistently rank near the bottom of the list, occupying nearly all of the 10 lowest spots for cost-adjusted construction wages as lower nominal pay outweighs the benefit of cheaper living expenses. Among the lowest are Florida ($47,740), Texas ($50,661), and Georgia ($51,707), where construction workers earn roughly 40% less—after adjusting for the cost of living—than their counterparts in Illinois.
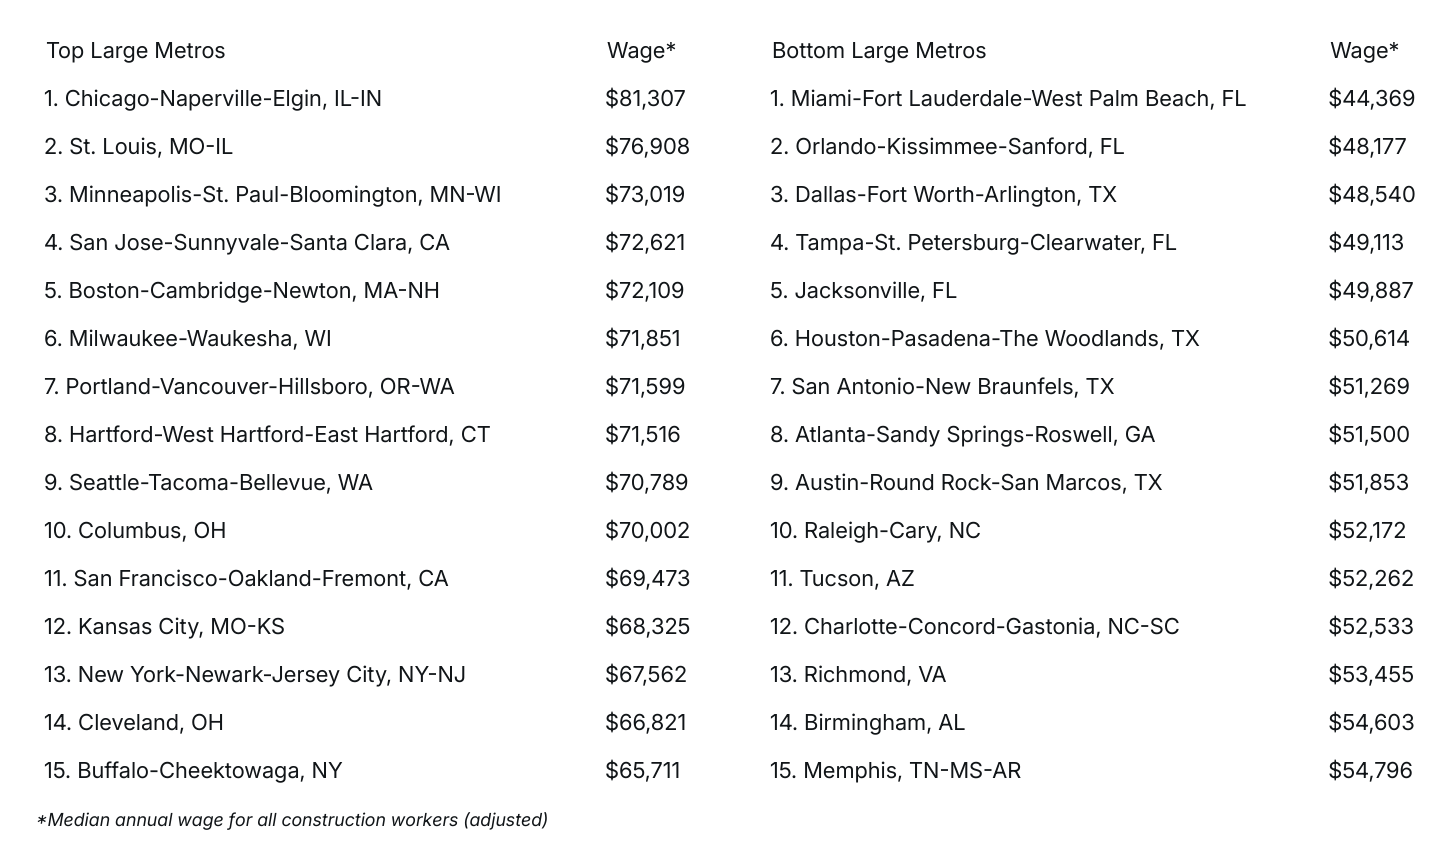
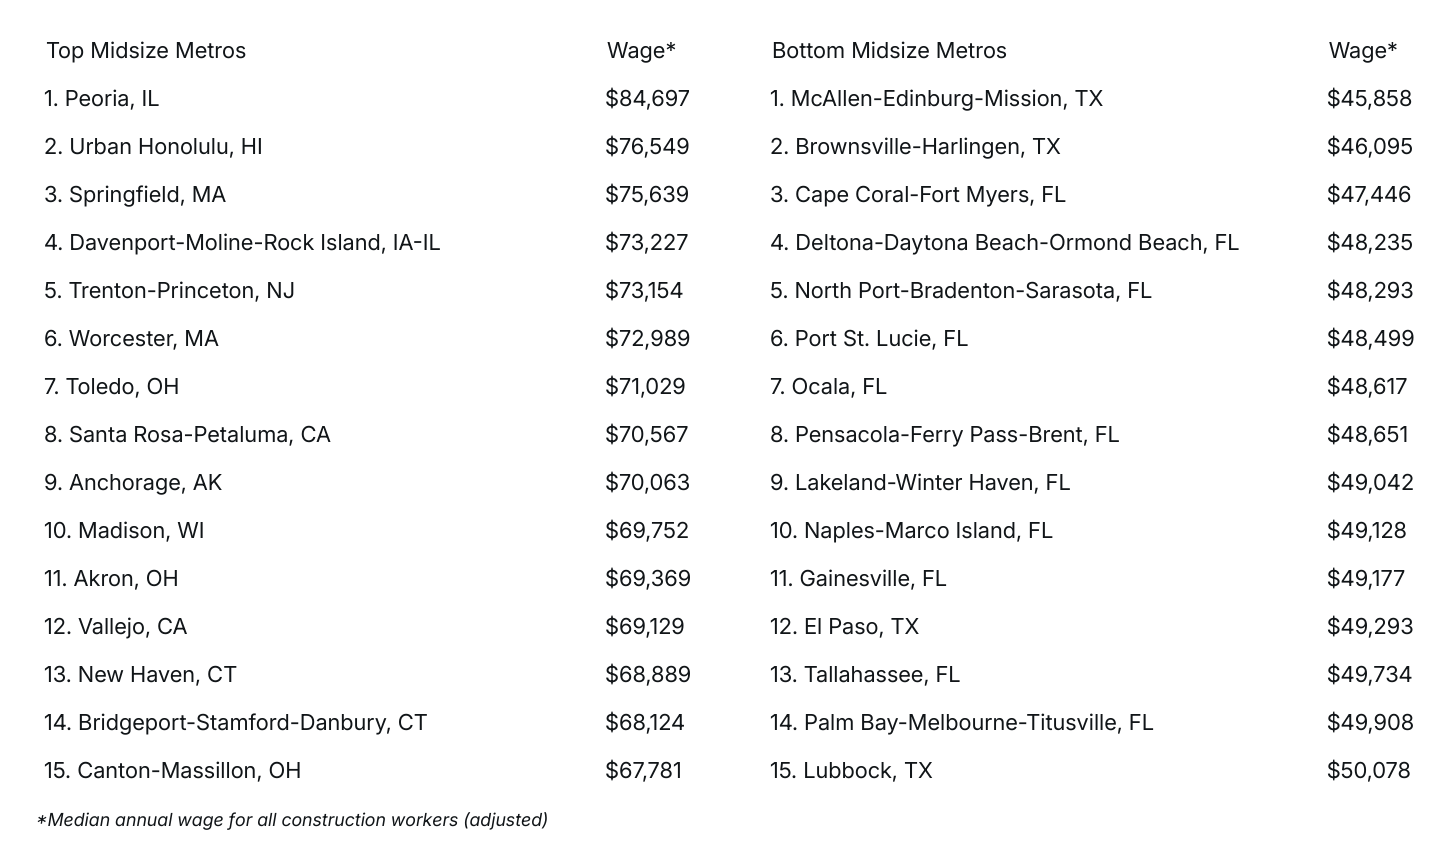
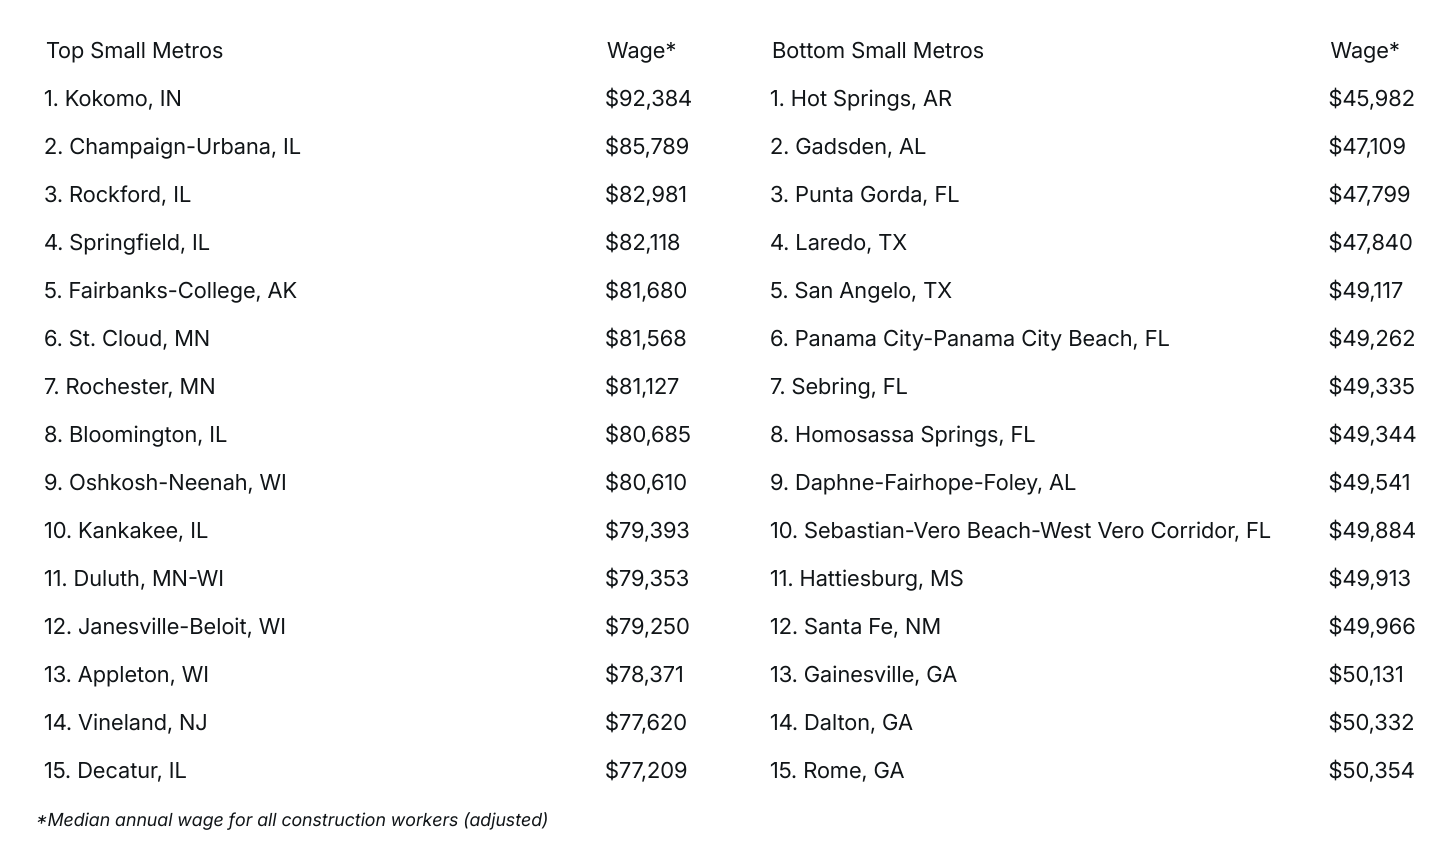
Similar patterns emerge at the local level. Many of the lowest-paying cities after cost-of-living adjustments are located in Southern states—particularly across Florida and Texas. Conversely, Midwestern cities are well represented among the top-paying locations across all size categories. However, among large metropolitan areas with populations over one million, several high-cost coastal cities also rank near the top due to high nominal pay, including San Jose, Boston, Portland, Seattle, San Francisco, and New York.
For additional information on how the analysis was conducted, refer to the methodology section. For complete results, see The Best-Paying Cities for Construction Workers on Construction Coverage.
The Highest-Paying Cities for Construction
The Highest-Paying States for Construction
Methodology

Photo Credit: Afotostock / Shutterstock
To determine the top-paying locations for construction workers, researchers at Construction Coverage analyzed the latest data from the U.S. Bureau of Labor Statistics’ 2025 Occupational Employment and Wage Statistics, the U.S. Bureau of Economic Analysis’ 2024 Regional Price Parities, and the U.S. Census Bureau’s 2024 American Community Survey. The researchers ranked locations according to the cost-of-living-adjusted median annual wage for construction workers. For the purposes of this analysis, construction workers were considered to be all wage and salary workers on nonfarm establishments with occupations classified under the Construction and Extraction Occupations major occupation group. In the event of a tie, the location with the larger unadjusted median annual wage for construction workers was ranked higher.
Only metropolitan areas and states with available data were included in the analysis. Additionally, metro areas were grouped into the following cohorts based on population size:
- Small metros: Less than 350,000
- Midsize metros: 350,000–999,999
- Large metros: 1,000,000 or more
For complete results, see The Best-Paying Cities for Construction Workers on Construction Coverage.

